
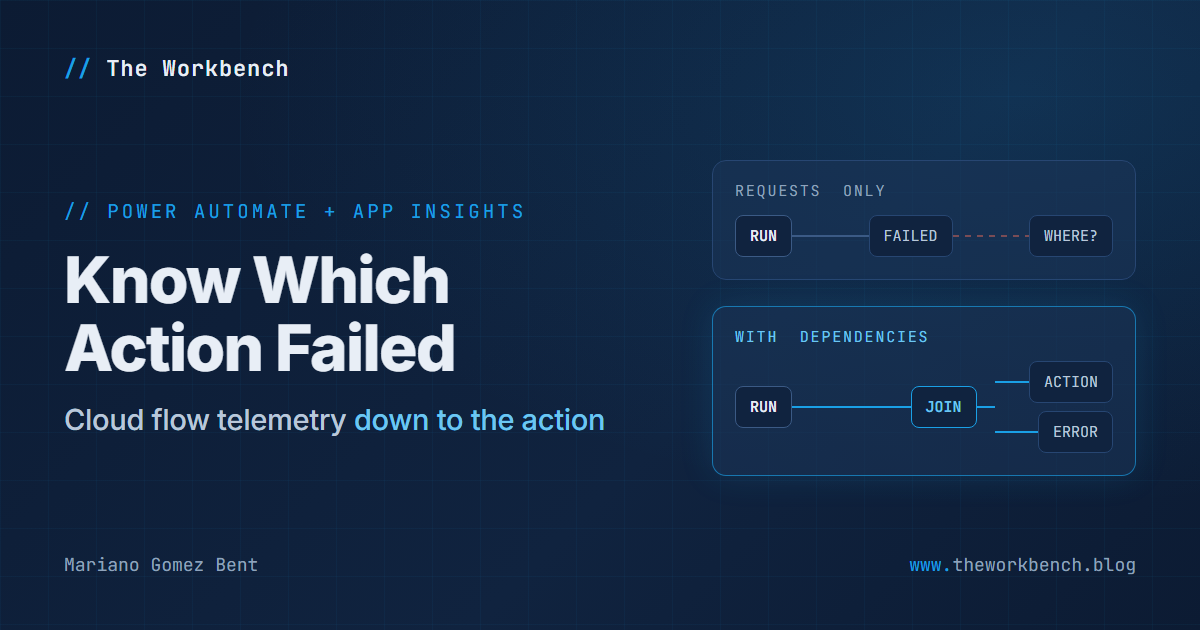
Longtime readers may remember that the very last article I published before this blog went quiet, back in August of 2021, covered monitoring Power Apps with Azure Application Insights. So it is only fitting that I return to the subject from the other side of the platform: getting cloud flow telemetry out of Power Automate and into Application Insights, down to the action level.
I will be honest about why I am writing this one. When I went looking for how this integration works, the picture I pieced together from searching around was incomplete, and once I configured it and read the actual tables, I understood why: the feature is admin-gated where makers cannot see it, and the telemetry schema is not what instinct suggests. I made the wrong assumption myself before the data corrected me! So, in this article I will walk through how the integration actually works, the schema surprise that changes how you query it, and the Kusto queries that turn "the flow failed" into "the flow failed at this action, with this error."
First things first: yes, the integration exists
Power Automate cloud flow telemetry can be exported to Azure Application Insights, and keep in mind, this is not a maker feature -- which is the source of a lot of the confusion. Canvas apps let a maker paste an instrumentation key into the app and start calling Trace(). Cloud flows offer nothing of the sort, and for a sound reason: flows have no client runtime to instrument. They execute server-side on shared infrastructure, so the integration was built as a platform-level export instead.
The setup lives in the Power Platform admin center, under Data export.

An administrator creates an export package, selects Power Automate as the data type, chooses the environment, and points it at an Application Insights resource. Three requirements to check before you start, because each one can stop you cold:
- The environment must be a Managed Environment. The feature is gated behind this governance tier, which is exactly why a maker who goes looking for it at the flow level concludes it does not exist. It does; it just lives upstairs.
- You need admin rights, not maker rights. Power Platform administrator or Dynamics 365 administrator at the tenant level, plus environment or system administrator in the Dataverse environment.
- You need Contributor rights or better on the Application Insights resource itself, over on the Azure side.
NOTE: once configured, expect up to 24 hours before telemetry starts appearing. Initial patience is required; ongoing latency is much lower. Do not spend that first afternoon rewriting your export package because the tables look empty!
The schema surprise: two tables, not one
Here is the assumption I walked in with: every action a flow executes, including the trigger, lands as an entry in the Application Insights requests table. It seems reasonable. It is also not how the schema works, and the difference matters more than any other detail in this article. As it turns out, the export splits telemetry across two tables:
| Table | Contains | signalCategory value |
|---|---|---|
requests | Cloud flow runs | "Cloud flow runs" |
dependencies | Cloud flow triggers and actions | "Cloud flow triggers" / "Cloud flow actions" |
In turn, if your monitoring queries only touch requests, you are monitoring at the run level. You will know a flow failed. You will not know which action failed, how long each action took, or whether a specific connector call is degrading over time. All of that lives in dependencies, waiting to be queried.
There is a second, related detail that took me a moment to appreciate. When you configure the export package, you explicitly choose whether to export cloud flow runs, triggers, or actions. These are separate checkboxes! If you only selected runs during setup, action telemetry never leaves the platform, and no Kusto query will conjure it afterward. Granularity is decided at configuration time, not query time.
Run-level monitoring: the baseline
Run-level failure alerting is the right starting point, and the query looks as follows:
requests
| where customDimensions.signalCategory == "Cloud flow runs"
| where success == false
| extend flowId = tostring(customDimensions["resourceId"]),
         environmentId = tostring(customDimensions["environmentId"])
| project timestamp, name, resultCode, duration, flowId, environmentId, operation_Id
A few things to note here. Filtering on signalCategory matters because your Application Insights instance may be collecting telemetry from many sources, and this keeps the flow signals separated from everything else. Filtering on environmentId matters when multiple environments export to the same resource. Wire this query to an Azure Monitor alert rule, and you have real-time failure notifications by email, SMS, or webhook.
Action-level monitoring: where the real value is
Now, with the actions checkbox enabled in your export package, the dependencies table gives you per-action telemetry:
dependencies
| where customDimensions.signalCategory == "Cloud flow actions"
| where success == false
| extend flowId = tostring(customDimensions["resourceId"])
| project timestamp, name, resultCode, duration, flowId, operation_Id
The name field carries the action name exactly as it appears in the flow designer. This is the query that turns "the invoice approval flow failed" into "the invoice approval flow failed at the vendor validation HTTP call with a 429."
Correlation is what makes the two tables work together. The operation_Id on an action's dependency row matches the operation_Id on the parent run's request row, so you can join them:
requests
| where customDimensions.signalCategory == "Cloud flow runs"
| where success == false
| join kind=inner (
    dependencies
    | where customDimensions.signalCategory == "Cloud flow actions"
    | where success == false
  ) on operation_Id
| project runTime = timestamp, flowRun = name,
          failedAction = name1, actionResult = resultCode1, actionDuration = duration1
What this join produces is a failure report at the granularity your support team actually needs: which run, which action, what error, and how long it ran before dying. The name1, resultCode1, and duration1 columns are Kusto's automatic renames for the joined table's fields; the projection gives them names a human can read.
Beyond failures, the same table supports performance work. Percentile queries over duration by action name will surface connector calls that are slowly degrading long before they start timing out, which is exactly the kind of early signal run-level monitoring can never provide.
Three caveats before you turn everything on
NOTE 1: ingestion cost scales with granularity. Application Insights bills per GB ingested, and action-level export on a busy flow with Apply to each loops generates a row per action, per iteration, per run. A flow processing a few thousand records nightly can produce telemetry volume that surprises you at invoice time. Scope the export deliberately: enable action-level export for the flows that justify it rather than blanketing the environment.
NOTE 2: validate scope nesting behavior empirically. If your flows use the Try/Catch pattern built on Scope containers, test how nested actions surface before you write production alert queries. Build a flow with a deliberately failing action inside a scope, run it, and inspect what lands in dependencies. Ten minutes with a test flow will teach you more than any amount of reading, and your failure queries should be written against observed behavior rather than assumptions. I know so as I've done so myself!
NOTE 3: treat the export as telemetry, not as a system of record. Microsoft is explicit that small data losses can occur due to transient service issues. The flow run history inside the Power Automate portal remains the transactional, authoritative record. Application Insights is for alerting, dashboards, and trend analysis, not for audit-grade completeness.
What about custom telemetry from inside a flow?
The export covers runs, triggers, and actions, but you may be asking, "where is the Trace() function for flows?" Very simple: there is no native equivalent. If you need business-level events -- "vendor matched," "payment batch released" -- the pattern is an HTTP action posting directly to the Application Insights ingestion endpoint at https://dc.services.visualstudio.com/v2/track, or preferably the regional endpoint from your resource's connection string. No authentication header is required; the instrumentation key inside the payload identifies the target resource:
{
  "name": "Microsoft.ApplicationInsights.Event",
  "time": "@{utcNow()}",
  "iKey": "<your-instrumentation-key>",
  "data": {
    "baseType": "EventData",
    "baseData": {
      "name": "InvoiceApprovalFlow.Step3.VendorMatched",
      "properties": {
        "flowRunId": "@{workflow()['run']['name']}",
        "flowName": "@{workflow()['name']}",
        "environment": "@{workflow()['tags']['environmentName']}",
        "vendorId": "@{variables('vendorId')}"
      },
      "measurements": {
        "recordsProcessed": 42,
        "durationMs": 1830
      }
    }
  }
}
A few things to note about this payload. Events posted this way land in the customEvents table. Swap baseType to TraceData with a message and severityLevel for trace-style logging, or to ExceptionData for structured errors. And carrying the flow run ID in the properties gives you a correlation key back to the platform-exported tables, so your business events join cleanly against the runs and actions they belong to.
Centralize it in a child flow
Do not scatter this HTTP action across every flow you own! Build it once as a child flow -- call it something like "LogTelemetry" -- and have every parent flow call it as a single action. The child flow takes three inputs:
- Event name (text): the dotted event identifier, such as
InvoiceApprovalFlow.Step3.VendorMatched - Properties (text): a JSON string of custom dimensions, parsed and merged into the payload inside the child
- Severity (text or number): drives whether the child posts EventData, TraceData, or ExceptionData
In turn, the child flow owns the instrumentation key, the endpoint URL, and the payload envelope. When the ingestion endpoint changes, when you rotate the key, or when you decide to enrich every event with the environment name, you change one flow instead of forty. Parent flows stay clean: one "Run a child flow" action per telemetry point, and no HTTP plumbing in sight.
The same child flow pairs naturally with Scope-based error handling. Wrap your business logic in a Try scope, follow it with a Catch scope configured to run after "has failed" and "has timed out," and inside the Catch use result('Try') to extract the failed action details and pass them to LogTelemetry as an ExceptionData payload. That gives you structured failure telemetry carrying the actual action error, not just a run that shows red in the portal.
NOTE: two constraints to know before you commit to this pattern. The HTTP connector requires premium licensing, and the raw post does not work if your Application Insights resource enforces Entra ID-only ingestion. In that case, a small Azure Function relay running the real SDK is the better shape, since a flow cannot easily perform the token acquisition against Azure Monitor scopes.
And to save you the scaffolding: I built LogTelemetry exactly as described and published it as an importable solution on GitHub, over at github.com/dgpblogster/power-automate-logtelemetry. It uses no connectors that require authentication, so the import prompts for nothing; you replace two clearly-marked CONFIG values, turn it on, and start logging. The README walks the import click by click.
The bottom line
Power Automate telemetry in Application Insights is real, admin-configured, and gated behind Managed Environments. Runs live in requests; triggers and actions live in dependencies. If your monitoring stops at the requests table, you have built a smoke detector that tells you the building is on fire without telling you which room. The dependencies table, an export package with the actions checkbox enabled, and one join on operation_Id are all it takes to do better.
If you have wired up this export yourself, or found other signals hiding in these tables worth querying, please drop a note in the comments describing your experience; telemetry patterns get better every time somebody shares what they found in the data.
Until next post!
MG.-
Mariano Gomez Bent
Former Microsoft BizApps MVP

Comments